Sources

R packages

"ape" (Paradis et al. 2004)

"caper" (Orme et al. 2012)

"geiger" (Harmon et al. 2008)

"phytools" (Revell 2012)

Data

Primate phylogeny ("primate_tree.phy"), phylogeny in phylip format, phylogeny of primates from Arnold et al. (2010)

Species-specific trait data ("primate_spec.txt"), a tab separated text file, species-specific data for brain size and body size in primates

Sample of phylogenetic trees ("bird_trees.tre"), a block of phylogenies for birds from Jetz et al. (2012) in nexus format

Codes

library(ape)
library(caper)
library(geiger)
library(phytools)

Exercise 1: Importing a tree from a file

#To import a tree file in Newick (phylip) format
tree=read.tree("primate_tree.phy")
#To import a tree file in Nexus format. Note that this particular file has a subsample of trees, and thus a multi.phylo object is created.
trees=read.nexus("bird_trees.tre")

Exercise 2: Creating a phylogenetic tree with random resolution or a star phylogeny for a list of species

#Read data first
xdata = read.table("primate_spec.txt", sep = "\t", header = T)
#For some functions species' names should be the row names
row.names(xdata)=xdata$species

#Random tree created by randomly splitting the edges, n is the number of species and we use the list of primate species to name the tips.
rnd.tree=rtree(n=length(xdata$species), rooted = TRUE, tip.label = as.character(xdata$species))

#The two commands below can create a star phylogeny from a bifurcating tree.
tree0=rescale(rnd.tree, "lambda", 0)
tree0=di2multi(compute.brlen(tree0, 0.1), tol = 1)

#plot
layout(matrix(1:3, 1, 3))
plot(ladderize(tree), cex=0.8)
title("True phylogeny")
plot(ladderize(rnd.tree), cex=0.8)
title("Random phylogeny")
plot(ladderize(tree0), cex=0.8)
title("Star phylogeny")
plot of chunk unnamed-chunk-3
#some checks
is.ultrametric(rnd.tree)
## [1] FALSE
is.ultrametric(tree0)
## [1] TRUE
is.rooted(rnd.tree)
## [1] TRUE
is.rooted(tree0)
## [1] FALSE

Exercise 3: Adding/removing species to/from the phylogeny

#To remove a particular species from the phylogeny (e.g. if no data is available for that species)
tree.prun1=drop.tip(tree,"Ateles_belzebuth")

#To remove all the species of a particular genus. Taking advantage of R's flexibility we can simply search all tip labels (species) containing the genus name.
tree.prun2=drop.tip(tree, tree$tip.label[agrep("Cercopithecus", tree$tip.label,max.distance = 1)])

#To remove all species within the clade Strepsirrhini. This exercise is simplified by the fact that the taxonomy is coded within the datafile.
tree.prun3=drop.tip(tree, as.character(xdata[agrep("Strepsirrhini", xdata$suborder,max.distance = 0),]$species))

#To remove species (tips in the tree) that are not in the data file. Note the use of setdiff to compare the species names in the phylogeny (tip.label) to the species names in the data file.
tree.prun4=drop.tip(tree, setdiff(tree$tip.label,as.character(xdata[3:15,]$species)))

#To add tips at random to a tree with branch lengths, n is the number of species to add and tips is used to assign tip.labels.
tree.prun5=add.random(tree.prun4, n=2, tips=c("species1", "species2"))

#To add a tip at the root of a specific genus.
tree.prun6=add.species.to.genus(tree.prun4,"Ateles_sp")

#Finally a tip can also be added at a specific position.
tree.prun7=bind.tip(tree.prun4, "Ateles_sp", where=which(tree.prun4$tip.label=="Ateles_paniscus"), position=1)

#To add a clade to a tree (sticking two trees together)
receptor=tree.prun7
receptor$tip.label[14]="NA"
#this is the clade we want to add
donor=rtree(5, tip.label =c("Ateles_sp1", "Ateles_sp2","Ateles_sp3", "Ateles_sp4","Ateles_sp5"))
donor$root.edge=0
tree.prun8=paste.tree(receptor, donor)

#Try ploting any of the above to see what it looks like
plot(ladderize(tree.prun7), cex=0.8)
plot of chunk unnamed-chunk-4
plot(ladderize(tree.prun8), cex=0.8)
plot of chunk unnamed-chunk-4

Exercise 4: Moving branches

#Move a particular tip (Ateles_sp) to the root
tree.rooted=root(tree.prun6, "Ateles_sp", resolve.root=T)

Exercise 5: Aletring branch lengths

#Grafen's branch lengths adjustments

#all branches equal to 1
tree.prun6.bl1=compute.brlen(tree.prun6, 1)
tree.prun6.bl1=tree.prun6
tree.prun6.bl1$edge.length=rep(1, length(tree.prun6$edge.length))

#scaling branches differently depending on the position relative to the root
layout(matrix(1:4, 2, 2))
plot(compute.brlen(tree.prun6, power=1), main=expression(rho==1), cex=0.8)
plot(compute.brlen(tree.prun6, power=3), main=expression(rho==3), cex=0.8)
plot(compute.brlen(tree.prun6, power=0.5), main=expression(rho==0.5), cex=0.8)
plot(compute.brlen(tree.prun6, power=0.1), main=expression(rho==0.1), cex=0.8)
plot of chunk unnamed-chunk-6
layout(1)

#Pagels' branch length adjustments 
#Lambda
layout(matrix(1:3,1,3))
plot(rescale(tree.prun6, "lambda", 0), edge.width=1.5, cex=0.8)
mtext("Lambda = 0")
plot(rescale(tree.prun6, "lambda", 0.5), edge.width=1.5, cex=0.8)
mtext("Lambda = 0.5")
plot(tree.prun6, edge.width=1.5, cex=0.8)
mtext("Lambda = 1 (default)")
plot of chunk unnamed-chunk-6
layout(1)

layout(matrix(1:3,1,3))
plot(rescale(tree.prun6, "kappa", 0), edge.width=1.5, cex=0.8)
mtext("Kappa = 0")
plot(rescale(tree.prun6, "kappa", 1), edge.width=1.5, cex=0.8)
mtext("Kappa = 1 (default)")
plot(rescale(tree.prun6, "kappa", 2), edge.width=1.5, cex=0.8)
mtext("Kappa = 2")
plot of chunk unnamed-chunk-6
layout(1)

layout(matrix(1:3,1,3))
plot(rescale(tree.prun6, "delta", 0.1), edge.width=1.5, cex=0.8)
mtext("Delta = 0.1")
plot(rescale(tree.prun6, "delta", 1), edge.width=1.5, cex=0.8)
mtext("Delta = 1 (default)")
plot(rescale(tree.prun6, "delta", 2), edge.width=1.5, cex=0.8)
mtext("Delta = 2")
plot of chunk unnamed-chunk-6
layout(1)

Tree transformations are now available in the function rescale()!

#Other transformations
layout(matrix(1:3,1,3))
plot(rescale(tree.prun6, model="lambda", 1), edge.width=1.5, cex=0.8)
mtext("Brownian motion")
plot(rescale(tree.prun6, model="OU", 0.1), edge.width=1.5, cex=0.8)
mtext("Ornstein-Uhlenbeck model")
plot(rescale(tree.prun6, model="EB", 0.1), edge.width=1.5, cex=0.8)
mtext("Early-burst model")
plot of chunk unnamed-chunk-7
layout(1)

Exercise 6: Comparing trees

#Topological distance between two phylogenetic trees
dist.topo(tree.prun6, tree.prun7, method = "PH85")
## [1] 1
dist.topo(tree.prun6, tree.prun4, method = "PH85")
## [1] 8
dist.topo(tree.prun6, tree.prun4, method = "score")
## [1] 19.54
#Do two trees represent the same phylogeny?
all.equal.phylo(tree.prun6, tree.prun7)
## [1] FALSE
all.equal.phylo(trees[[3]], trees[[78]], use.edge.lenght=F)
## [1] FALSE
#Scanning a list of trees and removing duplicates
trees=unique(trees)
trees[[101]]=trees[[1]]
trees
## 101 phylogenetic trees
unique(trees)
## 100 phylogenetic trees
trees=unique(trees)

#Comparing two trees for matching nodes
matchNodes(tree.prun6, tree.prun4, "descendants")
##       tr1 tr2
##  [1,]  15  NA
##  [2,]  16  NA
##  [3,]  17  NA
##  [4,]  18  NA
##  [5,]  19  18
##  [6,]  20  NA
##  [7,]  21  20
##  [8,]  22  21
##  [9,]  23  22
## [10,]  24  23
## [11,]  25  24
## [12,]  26  25
matchNodes(trees[[1]], trees[[2]], "descendants")
##        tr1 tr2
##   [1,] 149 149
##   [2,] 150 150
##   [3,] 151 151
##   [4,] 152 152
##   [5,] 153 153
##   [6,] 154 154
##   [7,] 155 155
##   [8,] 156 156
##   [9,] 157 158
##  [10,] 158 157
##  [11,] 159 159
##  [12,] 160 283
##  [13,] 161 284
##  [14,] 162 287
##  [15,] 163 288
##  [16,] 164 289
##  [17,] 165 290
##  [18,] 166 291
##  [19,] 167 292
##  [20,] 168 293
##  [21,] 169 294
##  [22,] 170 295
##  [23,] 171 285
##  [24,] 172 286
##  [25,] 173 160
##  [26,] 174 161
##  [27,] 175 162
##  [28,] 176 163
##  [29,] 177 164
##  [30,] 178 165
##  [31,] 179 166
##  [32,] 180  NA
##  [33,] 181 168
##  [34,] 182 169
##  [35,] 183 171
##  [36,] 184 172
##  [37,] 185  NA
##  [38,] 186 173
##  [39,] 187 174
##  [40,] 188 175
##  [41,] 189 177
##  [42,] 190 178
##  [43,] 191 179
##  [44,] 192 176
##  [45,] 193 180
##  [46,] 194 274
##  [47,] 195 275
##  [48,] 196 276
##  [49,] 197 277
##  [50,] 198 278
##  [51,] 199 279
##  [52,] 200 280
##  [53,] 201 281
##  [54,] 202 282
##  [55,] 203 181
##  [56,] 204 182
##  [57,] 205 183
##  [58,] 206 184
##  [59,] 207 187
##  [60,] 208 188
##  [61,] 209 189
##  [62,] 210 190
##  [63,] 211 191
##  [64,] 212 192
##  [65,] 213 185
##  [66,] 214 186
##  [67,] 215 193
##  [68,] 216 194
##  [69,] 217 195
##  [70,] 218 196
##  [71,] 219 197
##  [72,] 220 198
##  [73,] 221 199
##  [74,] 222 200
##  [75,] 223 201
##  [76,] 224  NA
##  [77,] 225  NA
##  [78,] 226 203
##  [79,] 227 205
##  [80,] 228 206
##  [81,] 229 204
##  [82,] 230 215
##  [83,] 231 216
##  [84,] 232 217
##  [85,] 233 218
##  [86,] 234  NA
##  [87,] 235 220
##  [88,] 236 221
##  [89,] 237 207
##  [90,] 238 212
##  [91,] 239 213
##  [92,] 240 208
##  [93,] 241 209
##  [94,] 242 210
##  [95,] 243 211
##  [96,] 244 222
##  [97,] 245 223
##  [98,] 246 224
##  [99,] 247 225
## [100,] 248 226
## [101,] 249 227
## [102,] 250 245
## [103,] 251 246
## [104,] 252 247
## [105,] 253 228
## [106,] 254 229
## [107,] 255 230
## [108,] 256 231
## [109,] 257 232
## [110,] 258  NA
## [111,] 259 234
## [112,] 260 235
## [113,] 261 236
## [114,] 262 237
## [115,] 263 239
## [116,] 264 240
## [117,] 265 244
## [118,] 266 241
## [119,] 267 242
## [120,] 268 243
## [121,] 269 238
## [122,] 270 248
## [123,] 271 249
## [124,] 272 250
## [125,] 273 253
## [126,] 274 269
## [127,] 275 270
## [128,] 276 271
## [129,] 277 272
## [130,] 278 273
## [131,] 279 254
## [132,] 280 255
## [133,] 281 256
## [134,] 282 257
## [135,] 283  NA
## [136,] 284 259
## [137,] 285 260
## [138,] 286 261
## [139,] 287 262
## [140,] 288 263
## [141,] 289 264
## [142,] 290 265
## [143,] 291 266
## [144,] 292 267
## [145,] 293 268
## [146,] 294 251
## [147,] 295 252

Exercise 7: Creating an ultrametric tree from an additive tree

For this exercise we will use non-parametric rate smoothing. The lambda parameter (not to be confused with lambda for branch length scaling) in this function defines the degree to which rates are allowed to vary across branches. Note that we do not advocate use of such transformations without any calibration points (either fossils or other information) if at all available these should be included!

is.ultrametric(trees[[1]])
## [1] TRUE
is.ultrametric(tree.prun6.bl1)
## [1] FALSE
tree.prun6.ultr=chronopl(tree.prun6.bl1, lambda=0.1)
is.ultrametric(tree.prun6.ultr)
## [1] TRUE
layout(matrix(1:2,1,2))
plot(tree.prun6.bl1, edge.width=1.5, cex=0.8)
mtext("Non-ultrametric tree")
plot(tree.prun6.ultr, edge.width=1.5, cex=0.8)
mtext("ultrametric tree")
plot of chunk unnamed-chunk-9
layout(1)

Exercise 8: Rooting an unrooted tree

is.rooted(tree.prun6)
## [1] TRUE
is.rooted(unroot(tree.prun6))
## [1] FALSE
tree.prun6.rerooted=root(unroot(tree.prun6), "Callithrix_jacchus", resolve.root=T)
is.rooted(tree.prun6.rerooted)
## [1] TRUE
layout(matrix(1:3,1,3))
plot(tree.prun6, edge.width=1.5, cex=0.8)
mtext("Original tree tree")
plot(unroot(tree.prun6), edge.width=1.5, cex=0.8)
mtext("Unrooted tree")
plot(tree.prun6.rerooted, edge.width=1.5, cex=0.8)
mtext("Re-rooted tree")
plot of chunk unnamed-chunk-10
layout(1)

Exercise 9: Creating alternative resolutions

Use the combinations of the functions in Exercise 3 (e.g. remove all species but 1 from a genus then add them back randomly)!

#define a group to randomize
rnd.group="Ateles"
#species affected
rnd.sp=tree.prun7$tip.label[agrep(rnd.group, tree.prun7$tip.label,max.distance = 1)]
#remove all but 1 species and make the remaining tree as receptor
receptor2= drop.tip(tree.prun7, rnd.sp[-1])
receptor2$tip.label[which(receptor2$tip.label %in% rnd.sp[1]==T)]="NA" #this is the random clade we want to add
donor2=rtree(length(rnd.sp), tip.label = rnd.sp)
donor2$root.edge=0
tree.prun7.rnd=paste.tree(receptor2, donor2)
plot(tree.prun7.rnd)
plot of chunk unnamed-chunk-11

Alternative solutions are possible!

Exercise 10: Resolving polytomies

is.binary.tree(tree.prun6)
## [1] FALSE
tree.prun6.bi=multi2di(tree.prun6, random = TRUE) #Random resolution of polytomies
is.binary.tree(tree.prun6.bi)
## [1] TRUE

Exercise 11: Comparing tip labels with the list of species in the dataset

The function name.check() is now being deprecated in "geiger". treedata() lists unmatched tip labels and row names as a warning message (row names should be species' names)

As an alternative one can compare two lists, one with the tip.labels of the tree and the other with the names of species in the data file

tree.species<-as.character(tree$tip.label)
data.species<-xdata$species
#listing the species in the tree not found in the data
tree.species[which((tree.species %in% data.species)==FALSE)]
## character(0)
#listing the species in the database not found in the tree
data.species[which((data.species %in% tree.species)==FALSE)]
## factor(0)
## 86 Levels: Allenopithecus_nigroviridis Alouatta_caraya ... Varecia_variegata_variegata

A simpler solution

setdiff(tree$tip.label,as.character(xdata$species))
## character(0)
#or if species' names are row names
setdiff(tree$tip.label,row.names(xdata))
## character(0)

The above vectors are empty indicating a perfect match between the tree and the data. However, if we intentionally create a mismatch by inducing a spelling error in a species' name, it will be detected.

xdata$species_mispelled<- gsub("Eulemur", "Lemur", xdata$species)
setdiff(tree$tip.label,as.character(xdata$species_mispelled))
## [1] "Eulemur_fulvus_fulvus" "Eulemur_mongoz"        "Eulemur_macaco_macaco"
setdiff(as.character(xdata$species_mispelled), tree$tip.label)
## [1] "Lemur_fulvus_fulvus" "Lemur_macaco_macaco" "Lemur_mongoz"

Note that the mismatch is often caused by spaces in the binary names in the datafile. This can be corrected as:

xdata$species<- gsub(" ", "_", xdata$species) #replaces spaces

Exercise 12: Basic tree visualization

See also Online Practical Material for Chapter 4!

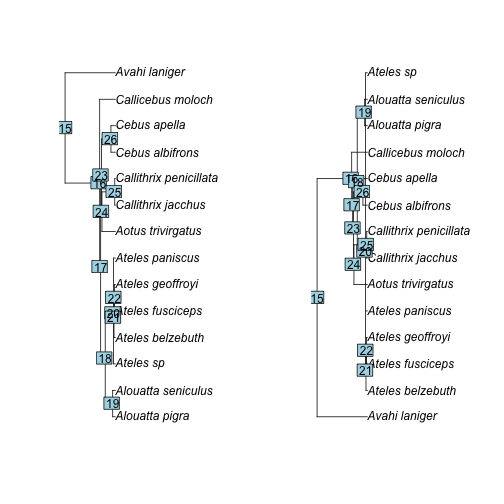
#rotating at nodes
par(mfrow=c(1,2))
plot(tree.prun6)
nodelabels()
plot(rotate(tree.prun6, 15))
nodelabels()
plot of chunk unnamed-chunk-17

Exercise 13: Plotting trait values on phylogeny

See also Online Practical Material for Chapter 4!

#Simulate some data to plot
#For discrete traits the transition matrix defines the evolutionary transitions between different states of the trait.
q<-list(rbind(c(-2,1,1),c(1,-2,1),c(1,1,-2)))
#Simulate evolution of the characters on the tree
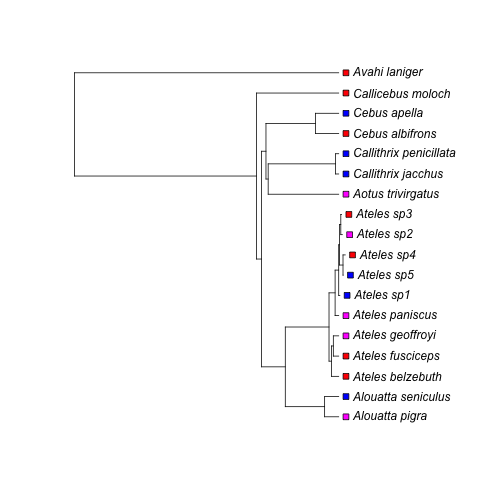
chars<-sim.char(tree.prun8, q, nsim=1, model="discrete")

#Plot the trait values on the tree
plot(tree.prun8, label.offset=4)
tiplabels(chars, frame="none", bg="white", adj=-1)
plot of chunk unnamed-chunk-18
#Or use different colors for the trait states
plot(tree.prun8, label.offset=4)
co<-c("red", "blue", "magenta")
tiplabels(pch=22, bg=co[as.numeric(chars)], cex=1.2, adj=2.5)
plot of chunk unnamed-chunk-18

Exercise 14: Handling a large number of trees

#Can read a file with multiple trees 
trees<-read.nexus("bird_trees.tre")
#To select a particular tree
fifth.tree<-trees[[5]]

Exercise 15: Estimating consensus tree

#Strict consensus
consensus.tree<-consensus(trees, p=1, check.labels=TRUE)
plot(consensus.tree)
plot of chunk unnamed-chunk-20
str(consensus.tree)
## List of 3
##  $ edge     : int [1:270, 1:2] 149 150 151 152 153 154 155 156 157 158 ...
##  $ tip.label: chr [1:148] "Phasianus_colchicus" "Perdix_perdix" "Alectoris_rufa" "Cygnus_columbianus" ...
##  $ Nnode    : int 123
##  - attr(*, "class")= chr "phylo"

Note the absence of branch lengths. For more details see discussion on this issue in r-sig.phylo: https://stat.ethz.ch/pipermail/r-sig-phylo/2012-November/002432.html

Exercise 16: Saving/exporting trees in different formats

To write a nexus file with a particular tree; in this case one tree from the list of bird trees from Jetz et al. (2012)

write.nexus(trees[[5]], file="Bird_tree5.nex")
write.tree(trees[[7]], file="Bird_tree7.tre")

Exercise 17: Simulating trees

#With branching times determined by a coalescent process
tr_coal<-rcoal(20, br="coalescent")
plot(tr_coal)
title("Random coalescent tree")
plot of chunk unnamed-chunk-22
#With branching times determined by a time-dependent birth-death process
tr_bd<-sim.bdtree(b=0.8, d=0.1, stop="taxa", n=30, extinct=TRUE)
plot(tr_bd)
title("Random Birth-death tree extinct included")
plot of chunk unnamed-chunk-22
#With branching times determined by a time-dependent birth-death process
#eliminating the extinct lineages
tr_bd2<-sim.bdtree(b=0.8, d=0.1, stop="taxa", n=30, extinct=TRUE)
tr_bd3<-drop.extinct(tr_bd2)
plot(tr_bd3)
title("Random Birth-death tree no extinct lineages")
plot of chunk unnamed-chunk-22

Exercise 18: Calculating variance-covariance matrix

V<-vcv.phylo(tree.prun8)

References